|
|
|
|
 |
 > Pictorial maps > Changing positions to better represent what we mean > Collections on the Internet dijous, 31 de maig de 2007
Representing an area, a geographic space, on paper is what map-making is all about. A map reduces the features of mountains, the coast, roads and cities to a tiny scale, serving as an orientation tool. Cartography would appear to be an exact science which simply involves reproducing the features of what we see. But it's not that simple. There are all kinds of determining factors (politics, for example) which prevent agreement on what should be represented and how.
However, what's more, the technique used to produce the map very clearly changes what we see. As the Earth is round and maps are flat, a way needs to be found of representing in two dimensions what is, in reality, in three dimensions. This representation (known as 'projection') usually involves differing interpretations depending on which technique has been applied and what calculations have been made. The recent appearance of satellites has taken geography and maps to a new level. These days, there's nothing uncommon about having a GPS in the car or, when we go on a trip, to see where were are on a map or what route we need to use to get to our destination. In the same way, newspapers and television stations increasingly use maps to explain situations. One of the most popular Internet programs, Google Earth, is, in reality, a great big map. We are living in a 'map renaissance age', going back to one of Man's oldest tools.
 
Pictorial maps)
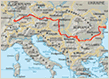
+ 'Angling in Troubled Waters', an 1899 map by Fred W. Rose.
Some mapmakers do not set out to represent the exact features of a country or continent. Instead, they adapt them to create a pictorial composition, normally for political purposes. One of the most famous examples is this tongue-in-cheek map of Europe in 1899 which made the mapmaker a fortune. It was by the cartographer Fred W. Rose and it represents the many problems Europe had at the time.
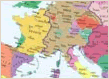
Changing positions to better represent what we mean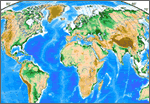
+ There are simple but powerful ways of representing information playing with cartography.
This map shows what the climate in Europe will be like in 2071. If you look closely, you'll see that the outline of Europe is the same but not the position of many of its cities. Barcelona, for example, is roughly where Morocco is and Oslo approximately where Teruel is. What did the cartographer mean with these tricks? That in 2071, Barcelona will have an average temperature of Morocco and temperatures in Oslo will be like they are in Teruel today. A simple but powerful way of representing information playing with cartography.
Collections on the Internet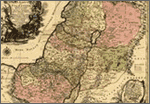
+ The Internet has given rise to the publication of numerous collections of maps.
The Internet has given rise to the publication of numerous collections of maps, particularly antique ones that, until now, have only been accessible to a few. This is the case, for example, with this great collection of old maps of Palestine and Israel, a region which is also known as the Holy Land. Highly schematic maps dating back to 1462 and very elaborate maps from 1927 can be found on the Internet. The images are of very high quality and allow maps to be studied as if we were in front of the original.
|
MATERIALS
QUE HO SABIES?
BANNER ACTUALITZATVols el banner de l'última notícia a la teva web? Copia aquest codi i enganxa-l'hi: <a href="http://www.vilaweb.cat CERCADOR DEL DIARI DE L'ESCOLAESCOLES EN XARXA
|
Investiga
> Europa, de la primeria del segle XII ençà.
> El traç dels rius del vell continent.

> Satèl·lits emprats per a fer mapes del temps.
> Fronteres canviants: Catalunya integrada a França en temps de Napoleó.
I també...
- La deformació d'una projecció tradicional, a partir d'una comparació entre Europa i l'Amèrica del Sud.
- El món, de l'inrevés.
- Comparança entre les projeccions de Peters i de Mercator.
Portada |
Europa Press |
El Punt |
La premsa |
Especials |
Diari de l'escola |
LesFinances.info |
Editorials |
Mail obert |
Els blocs |
Lletres
Tecnologia i ciència | Solidaritat | Cap de 7mana | Campus | El 9 | Presència | Fòrums | Enquestes | Xat | Correu
Traductor | Edicions en Pdf | Wap-pda | Biblioteca | Lletra més grossa
Tecnologia i ciència | Solidaritat | Cap de 7mana | Campus | El 9 | Presència | Fòrums | Enquestes | Xat | Correu
Traductor | Edicions en Pdf | Wap-pda | Biblioteca | Lletra més grossa
| Què és VilaWeb? Publicitat Mapa web Contacte | Una web de Partal, Maresma i Associats, S.L. |